
The Ontario
Energy
Report
Scroll down for the Energy Report or click here for the Annual Review.
fig. 1 Electricity Output by Fuel Type (2021)
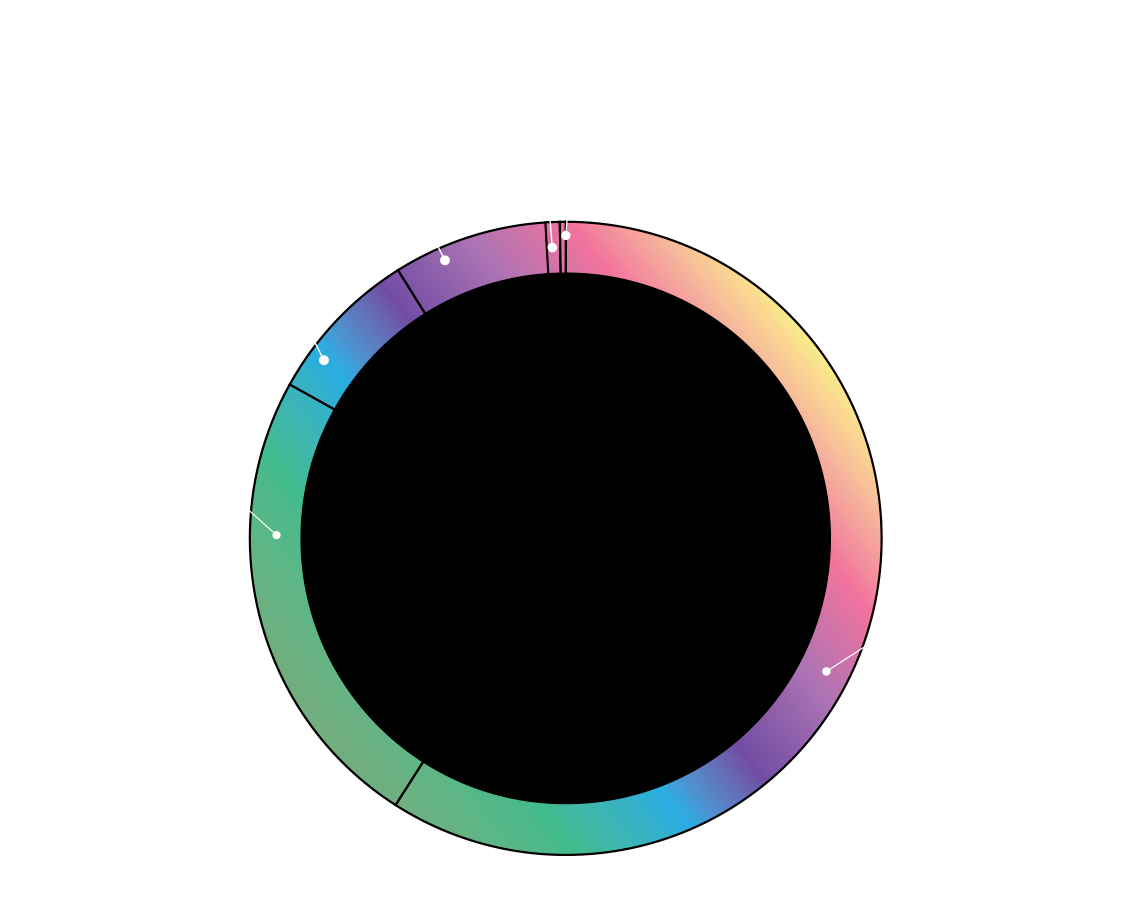
Electricity Output by Fuel Type (2021)
- Hydro: 24%
- Gas: 9%
- Wind: 8%
- Solar: 1%
- Biofuel: 0.3%
- Nuclear: 58%
Ontario’s energy supply mix
Ontario’s energy market has undergone significant transformation over the past decade and will undergo vast transformation in the years ahead.
Over the past two years, changes in demand and usage patterns as a result of the COVID-19 pandemic brought renewed spotlight on our electricity system and the importance of reliable, clean power. Throughout the pandemic Bruce Power nuclear provided safe, reliable electricity to the people and businesses of Ontario to help keep the lights on when needed the most.
By reliably generating that power while producing zero carbon emissions, Bruce Power is proud of the role it plays in keeping Ontario’s air clean and helping meet global emission reduction targets.
Bruce Power also provides the foundation Ontario needs to not only reduce emissions, but become a leader in innovation. We have been a proud and active partner of the Ontario government for many years, helping the province to explore opportunities to use nuclear power to decarbonize its economy and achieve its climate change objectives, while simultaneously maintaining a reliable and stable electricity grid.
Bruce Power takes its responsibility to contributing to a Net Zero future very seriously. From our Net Zero 2050 strategy launched last year, to our Net Zero 2027 commitment for our operations, carbon reduction community initiatives, the recent issue of the first-ever nuclear Green Bond and exploration of potential opportunities to explore and develop new nuclear technologies, we are working to demonstrate strong, tangible leadership in helping Canada reach its Net Zero by 2050 objectives while creating thousands of good-paying, highly-skilled jobs in the clean energy sector.
Bruce Power stands ready to move forward with significant investments and work projects to help meet those challenges, while providing economic recovery opportunities at the same time. Our actions demonstrate our commitment to our local community, as well as our province and country.
By reliably generating that power while producing zero carbon emissions, Bruce Power is proud of the role it plays in keeping Ontario’s air clean and helping meet global emission reduction targets.
Bruce Power also provides the foundation Ontario needs to not only reduce emissions, but become a leader in innovation. We have been a proud and active partner of the Ontario government for many years, helping the province to explore opportunities to use nuclear power to decarbonize its economy and achieve its climate change objectives, while simultaneously maintaining a reliable and stable electricity grid.
Bruce Power takes its responsibility to contributing to a Net Zero future very seriously.
From our Net Zero 2050 strategy launched last year, to our Net Zero 2027 commitment for our operations, carbon reduction community initiatives, the recent issue of the first-ever nuclear Green Bond and exploration of potential opportunities to explore and develop new nuclear technologies, we are working to demonstrate strong, tangible leadership in helping Canada reach its Net Zero by 2050 objectives while creating thousands of good-paying, highly-skilled jobs in the clean energy sector.
Bruce Power stands ready to move forward with significant investments and work projects to help meet those challenges, while providing economic recovery opportunities at the same time. Our actions demonstrate our commitment to our local community, as well as our province and country.
fig. 2 Demand through 2021
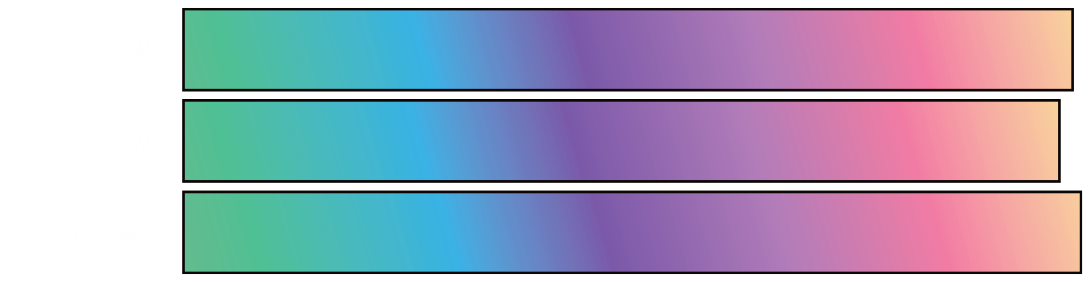
Demand through 2021
- 2021 133.8 TWh
- 2021 132.0 TWh
- 2019 135.1 TWh
Average demand in 2021 increased by 1.5 per cent year-over-year. The post-pandemic economic recovery impacted demand from commercial and retail load, while overall demand rebounded to pre-pandemic levels. Looking forward, we can expect continued recovery through 2022, as the province emerges from the pandemic and economic growth becomes the focus.

A year of global economic recovery
The first half of 2021 brought rising vaccination rates and the first steps to a return to normalcy for the residents and businesses of Ontario. While the new normal may still look different from our pre-COVID world, overall electricity demand rebounded to pre-pandemic levels this year.
In 2020, the pandemic created unusual and unexpected patterns in demand as it impacted all businesses in various ways. In 2021, overall demand in the province mostly stabilized, though there were some fluctuation patterns not typically seen pre-pandemic. Residential demand increased while commercial demand decreased slightly compared to pre-pandemic levels, as people continue to work from home. This has resulted in Ontario’s overall electricity demand patterns being much more sensitive to weather, as individual heating and cooling loads at historically uncommon times of day put pressure on the system.
In the midst of the unrelenting heat and humidity that gripped Ontario through the second hottest August on provincial record, electricity demand was predictably high. Bruce Power’s reliable power provided stability to Ontario’s electricity grid as the heatwave increased air conditioning load and electricity demand across all sectors all while keeping the province’s air clean with zero carbon emissions.
Frequent restrictions to importing power from Quebec during the heatwaves limited out-of-province power sourcing, while intermittent generators of electricity contributed 50 per cent less electricity in August than would be expected at other times in the year. Bruce Power and Ontario’s nuclear sector once again did the heavy lifting, providing the province with clean, reliable electricity when families and businesses needed it most.
In 2020, the pandemic created unusual and unexpected patterns in demand as it impacted all businesses in various ways. In 2021, overall demand in the province mostly stabilized, though there were some fluctuation patterns not typically seen pre-pandemic. Residential demand increased while commercial demand decreased slightly compared to pre-pandemic levels, as people continue to work from home. This has resulted in Ontario’s overall electricity demand patterns being much more sensitive to weather, as individual heating and cooling loads at historically uncommon times of day put pressure on the system.
In the midst of the unrelenting heat and humidity that gripped Ontario through the second hottest August on provincial record, electricity demand was predictably high.
Bruce Power’s reliable power provided stability to Ontario’s electricity grid as the heatwave increased air conditioning load and electricity demand across all sectors all while keeping the province’s air clean with zero carbon emissions.
Frequent restrictions to importing power from Quebec during the heatwaves limited out-of-province power sourcing, while intermittent generators of electricity contributed 50 per cent less electricity in August than would be expected at other times in the year. Bruce Power and Ontario’s nuclear sector once again did the heavy lifting, providing the province with clean, reliable electricity when families and businesses needed it most.
fig. 3 Market demand and generation type
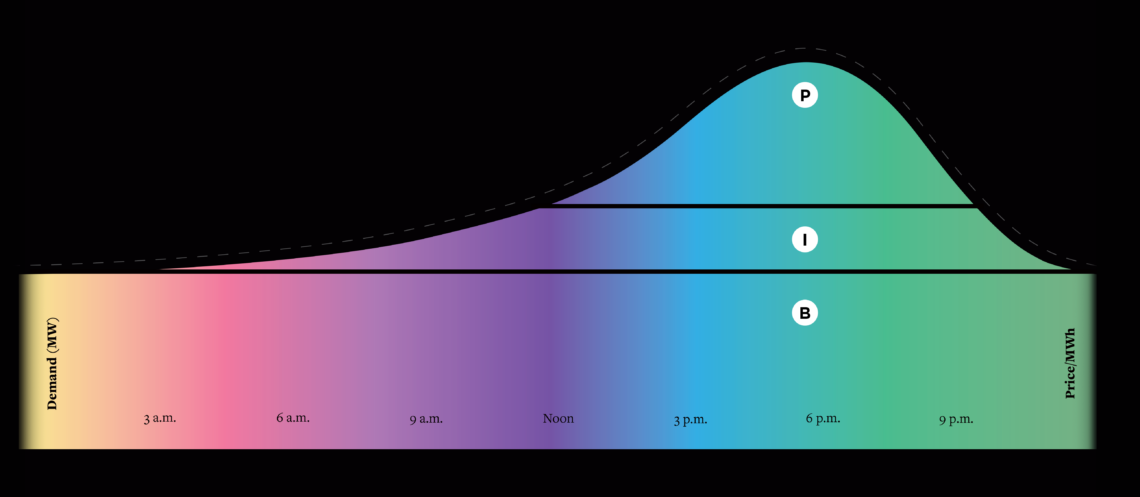
fig. 4 Cost of Electricity in Ontario 2021 (cents per kWh)
Cost of Electricity in Ontario 2021 (cents per kWh)
- Bruce Power Nuclear: 7.85
- Combined Ontario Nuclear: 9.6
- Gas: 12.5
- Wind: 15.4
- Solar: 49.8
- Biofuel: 26.7
- Hydro: 5.8
Source: Power Advisory forecast from RPP Price Report for NOV 2021 – OCT 2022, Ontario Energy Board
The cost of Bruce Power nuclear remained stable through 2021, even as the prices of other forms of generation fluctuated and increased due to the demand and operational challenges exacerbated by the COVID-19 pandemic.

The Bruce region can be a nexus for global leadership in the development of new technologies, including:
Bruce Power Major Component Replacement project will provide the province with carbon free electricity and life saving medical isotopes through 2064;
New nuclear builds, which—if needed to meet growing electricity demand—will benefit from existing infrastructure, licenses, and local expertise including Small Modular Reactors (SMRs), which are estimated to have a global market of $400-600 billion;
Hydrogen, which can be generated cleanly from nuclear power, and used as an emissions-free fuel to decarbonize other parts of our economy. The federal government projects that hydrogen will account for 30 per cent of end-use energy by 2050;
Developments in other promising technologies like batteries, storage, solar, and fusion energy.

Moving energy forward
Bruce Power provides the foundation Ontario needs to not only reduce emissions, but become a leader in innovation.
Research has shown that existing technologies won’t be enough to get us to net zero — we’ll also need new energy innovations. The Net Zero by 2050 report from the International Energy Agency (IEA) found that nearly 50 per cent of the emissions reductions required for net zero globally will depend on technologies still under development.
As Ontario moves towards an ambitious target of net zero emissions by 2050, demand from electrification, especially from adoption of electric vehicles and electrifying heavy industry, will significantly increase the need for clean electricity. Achieving Ontario’s net zero targets will require maximizing the value of our existing clean energy infrastructure to meet electrification demands, achieve efficiency gains, and encourage the adoption of new technologies.
Bruce Power and Ontario see a future as becoming global leaders in the development, testing and deployment of new technologies. The region has emerged as a Clean Energy Cluster that is driving energy innovation, with the Bruce site serving as a hub and the refurbishment program providing the stimulus to create the cluster.
Bruce Power continues to explore the potential for Small Modular Reactors (SMRs). In 2021, Bruce Power and Westinghouse completed a feasibility study with conclusive results that the Westinghouse eVinci™ micro-reactor has the potential to provide safe, reliable and low-carbon baseload power to remote, off-grid communities, mines and heavy industry and assist in Canada’s efforts to combat climate change.
As Ontario moves towards an ambitious target of net zero emissions by 2050, demand from electrification, especially from adoption of electric vehicles and electrifying heavy industry, will significantly increase the need for clean electricity. Achieving Ontario’s net zero targets will require maximizing the value of our existing clean energy infrastructure to meet electrification demands, achieve efficiency gains, and encourage the adoption of new technologies.
Bruce Power and Ontario see a future as becoming global leaders in the development, testing and deployment of new technologies.
The region has emerged as a Clean Energy Cluster that is driving energy innovation, with the Bruce site serving as a hub and the refurbishment program providing the stimulus to create the cluster.
Bruce Power continues to explore the potential for Small Modular Reactors (SMRs). In 2021, Bruce Power and Westinghouse completed a feasibility study with conclusive results that the Westinghouse eVinci™ micro-reactor has the potential to provide safe, reliable and low-carbon baseload power to remote, off-grid communities, mines and heavy industry and assist in Canada’s efforts to combat climate change.
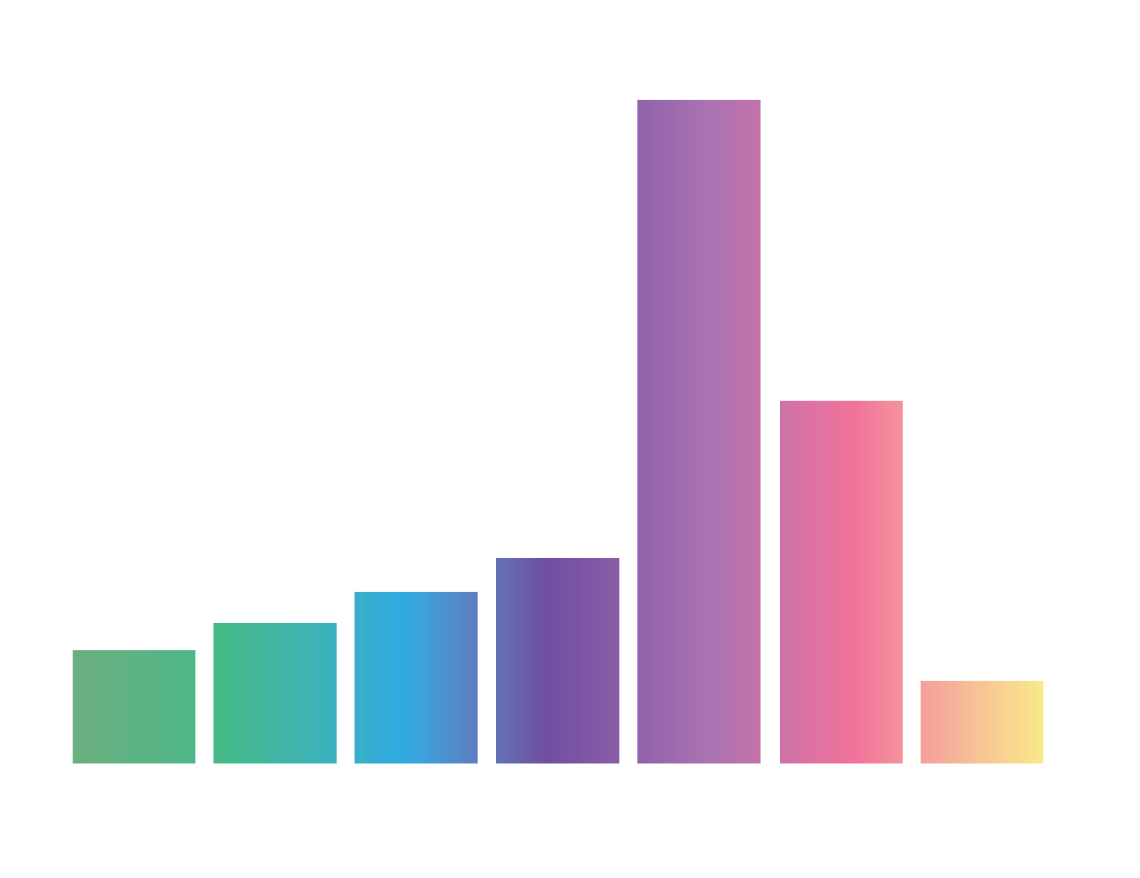
fig. 5 Bruce Power Output

Bruce Power Output
- Unit 1: 5.6 TWh
- Unit 2: 6.8 TWh
- Unit 3: 3.2 TWh
- Unit 4: 6.9 TWh
- Unit 5: 7.1 TWh
- Unit 6: 0.0 TWh
- Unit 7: 5.9 TWh
- Unit 8: 6.9 TWh
Bruce Power’s strong output through 2021 saw the company producing 30 per cent of the power for the province, with reliable, consistent operations.
Work on the Unit 6 Major Component Replacement continued as planned through the duration of 2021. Unit 3 underwent a planned outage for maintenance and inspection as a part of the ongoing MCR project. Thanks to these investments being made into the Bruce Power site today, we will be able to continue to provide reliable, emissions-free electricity for decades to come.
Reducing our footprint
The decarbonization of the electrical grid is a success story on a global level.
Very few jurisdictions have been able to reduce carbon emissions from their energy system as successfully as Ontario. Bruce Power provided 70 per cent of the electricity Ontario needed to shut down its coal-fired generating plants by 2014 and today, we’ve set our sights on loftier goals.
Between 2003 and 2012, Bruce Power brought four nuclear reactors back to life. This revitalization generated 70 per cent of the energy needed to phase out coal in Ontario and allowed the province to shut down all coal plants. While other jurisdictions have struggled to eliminate coal-fired generation from their energy system, Ontario was able to accomplish this target thanks to the existing nuclear technology and infrastructure in the province.
Nuclear provides 60 per cent of Ontario’s electricity while producing zero carbon emissions from generation, which is the equivalent of avoiding 19 million tonnes of greenhouse gases (GHGs) per year. While nuclear continues to provide the backbone of the electricity clean-energy supply in Ontario, Bruce Power and the nuclear industry will help the province achieve its objective of reducing emissions by 30 per cent below 2005 levels by 2030.
Bruce Power has committed to achieve Net Zero by 2027, which will account for all direct and indirect greenhouse gas (GHG) emissions that occur from sources that are owned or controlled by our company. In addition, we will account for indirect GHG emissions from the generation of purchased electricity or energy (e.g. heating steam) consumed by our company.
Bruce Power has a Net Zero partnership with the Nuclear Innovation Institute (NII) to help in the funding and development of additional carbon-offset projects in our local communities through the Carbon Offset Coalition.
fig. 6 Changes in electricity supply and GHG emissions
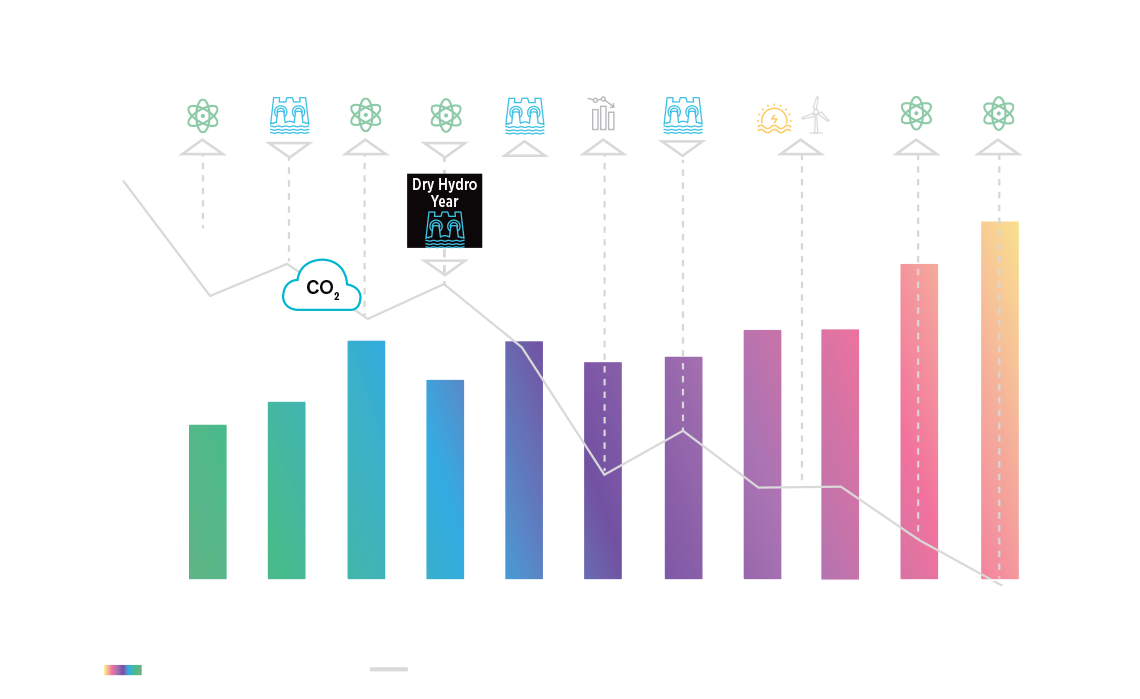
- 2003: no entry
- 2004: 14 TWh
- 2005: 16 TWh
- 2006: 22 TWh
- 2007: 18 TWh
- 2008: 22 TWh
- 2009: 20 TWh
- 2010: 21 TWh
- 2011: 23 TWh
- 2012: 23 TWh
- 2013: 27 TWh
- 2014: 33 TWh
- 2003 – no entry
- 2004 – Bruce 3, 4, Pickering 4: 25 Mt CO2
- 2005 – Dry Hydro Year: 27 Mt CO2
- 2006 – Pickering 1: 23 Mt CO2
- 2007 – Nuclear Outage: 26 Mt CO2
- 2008 – Wet Hydro Year: 21 Mt CO2
- 2009 – Recession: 10 Mt CO2
- 2010 – Dry Hydro Year: 13 Mt CO2
- 2011/12 – Renewables Introduced: 9 Mt CO2
- 2013 – BP Unit Restart 4 Mt CO2
- 2014 – Nuclear Operating Factor: below 0 Mt CO2
fig. 7 Emission intensity from the electricity sector by jurisdiction (gC02e/kWh)
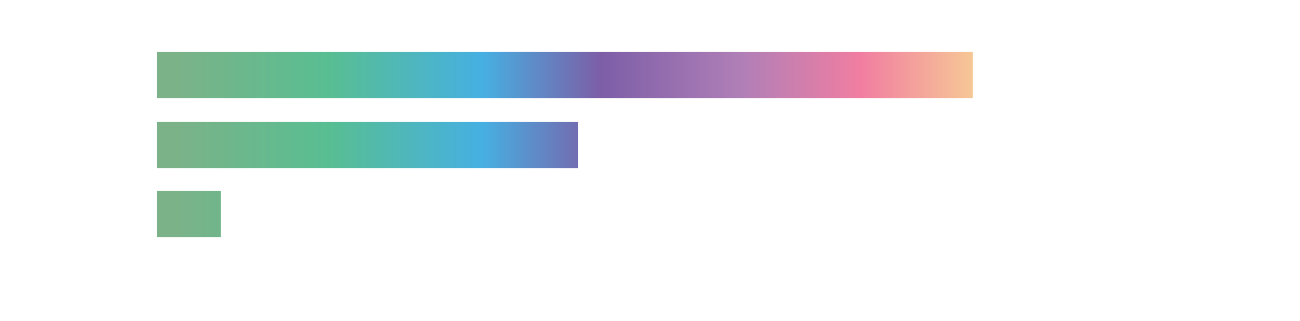
Emission intensity from the electricity sector by jurisdiction (gC02e/kWh)
- Germany: 370
- California: 195
- Ontario: 30
Source: U.S. Energy Information Administration (EIA), 2021, and Eurostat, 2021
In 2011, Germany decided to shut down its nuclear program, resulting in a power grid that is far more carbon-intensive and dependent on fossil fuels despite heavy investments in renewable generation such as wind and solar over the last decade.
California followed a similar path, abandoning nuclear power in favour of large-scale renewables, yet still seeing an uptick in emissions.
When viewed in contrast with Ontario, the results are clear: a low-emission grid powered by nuclear and hydro will retain system reliability while dramatically cutting emissions from the electricity sector.